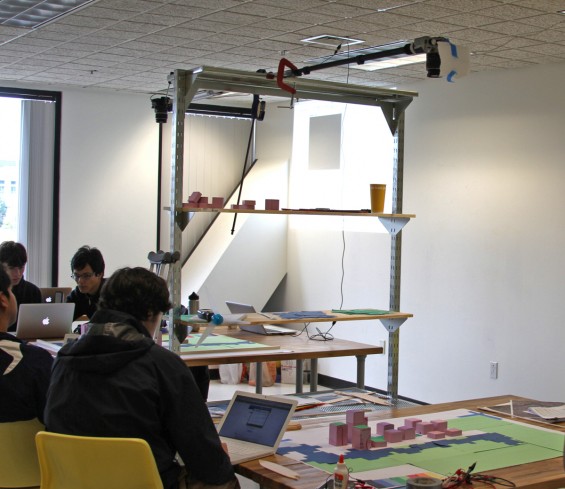
Our coaches David Quinn and Daniel Wiesmann have been working hard the past few weeks on developing a software tool that maps out energy production and consumption for cities. The software was developed using Netlogo, a simple programing language that was initially developed at the Media Lab, MIT. As you can see from the setup, a camera takes a picture of differently colored maps. Each color encodes a particular property like building height, green space, solar cells, etc. Based on these metrics, the software then instantly produces an analysis of the city.

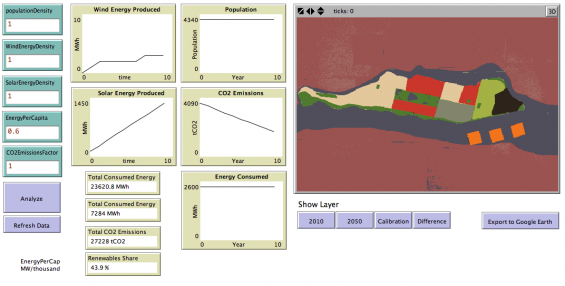
Here is the interface of the software:

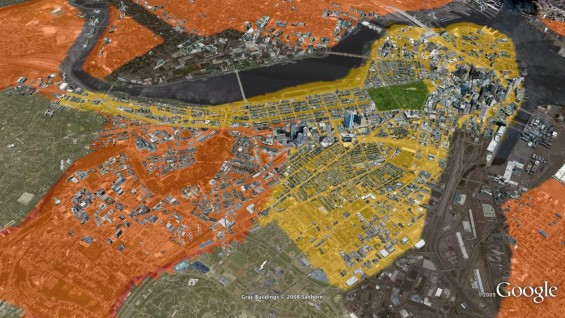
Images and the analysis can be easily imported to Google Earth.


